Experience
Professional experiences i've had
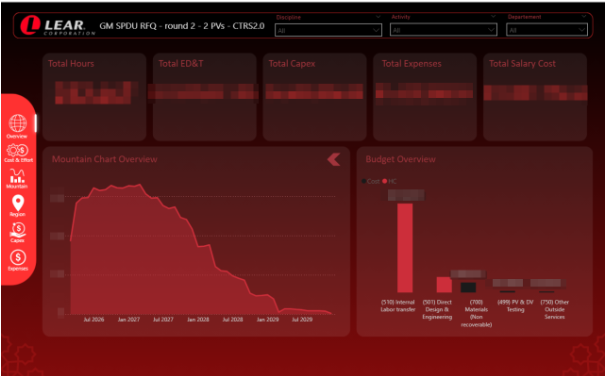
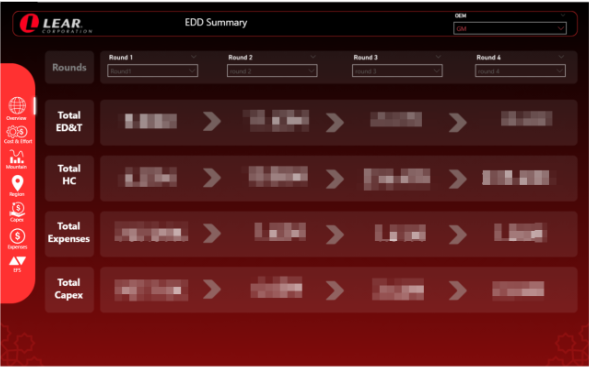
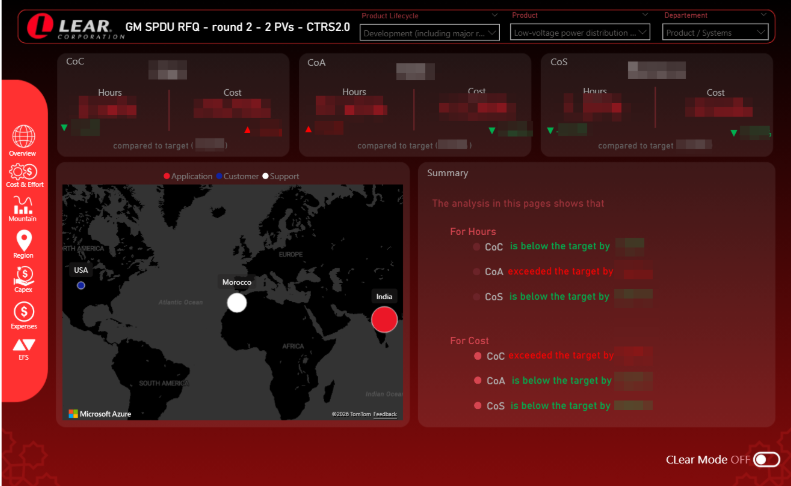
Implementation of a User-Centric BI Solution for Strategic RFQ KPIs (Lear Corporation | February – August 2026)
- Implemented a user-centric BI solution to monitor strategic KPIs and support data-driven decision-making.
- Analyzed RFQ data to improve business decisions and identify new customer opportunities.
- Developed a Python application to automate Excel data import, processing, and dashboard generation.
- Added new modules to meet business needs and improve analysis.
- Result: Reduced dashboard generation time from 2 weeks to an average of 30 seconds.
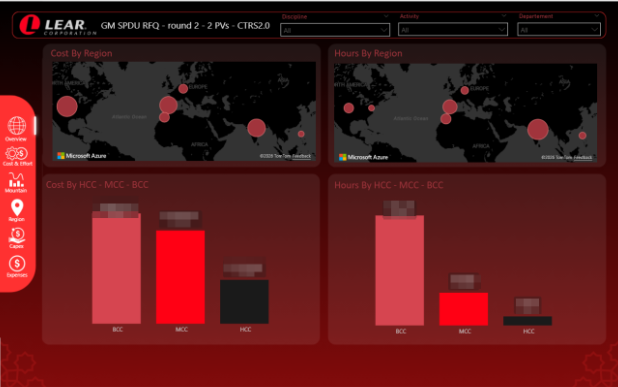
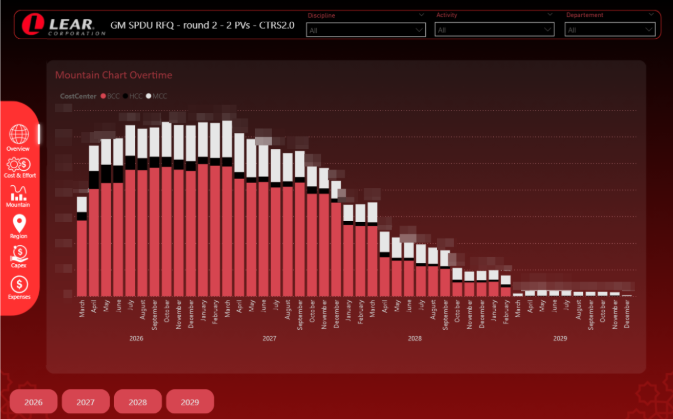
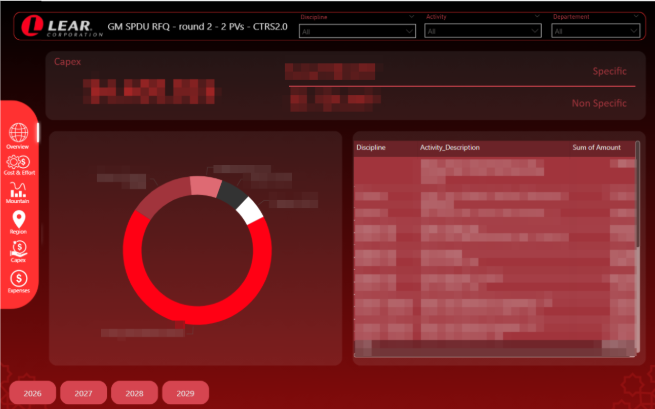
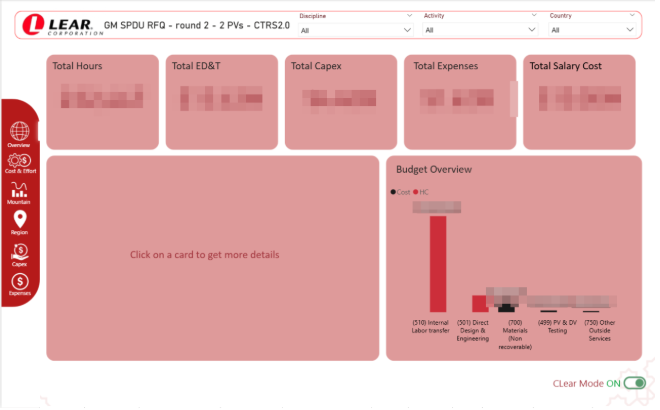
Used tools: Python, SSIS, SSMS, Power BI, Excel
Soft Skills: Business Requirements Analysis
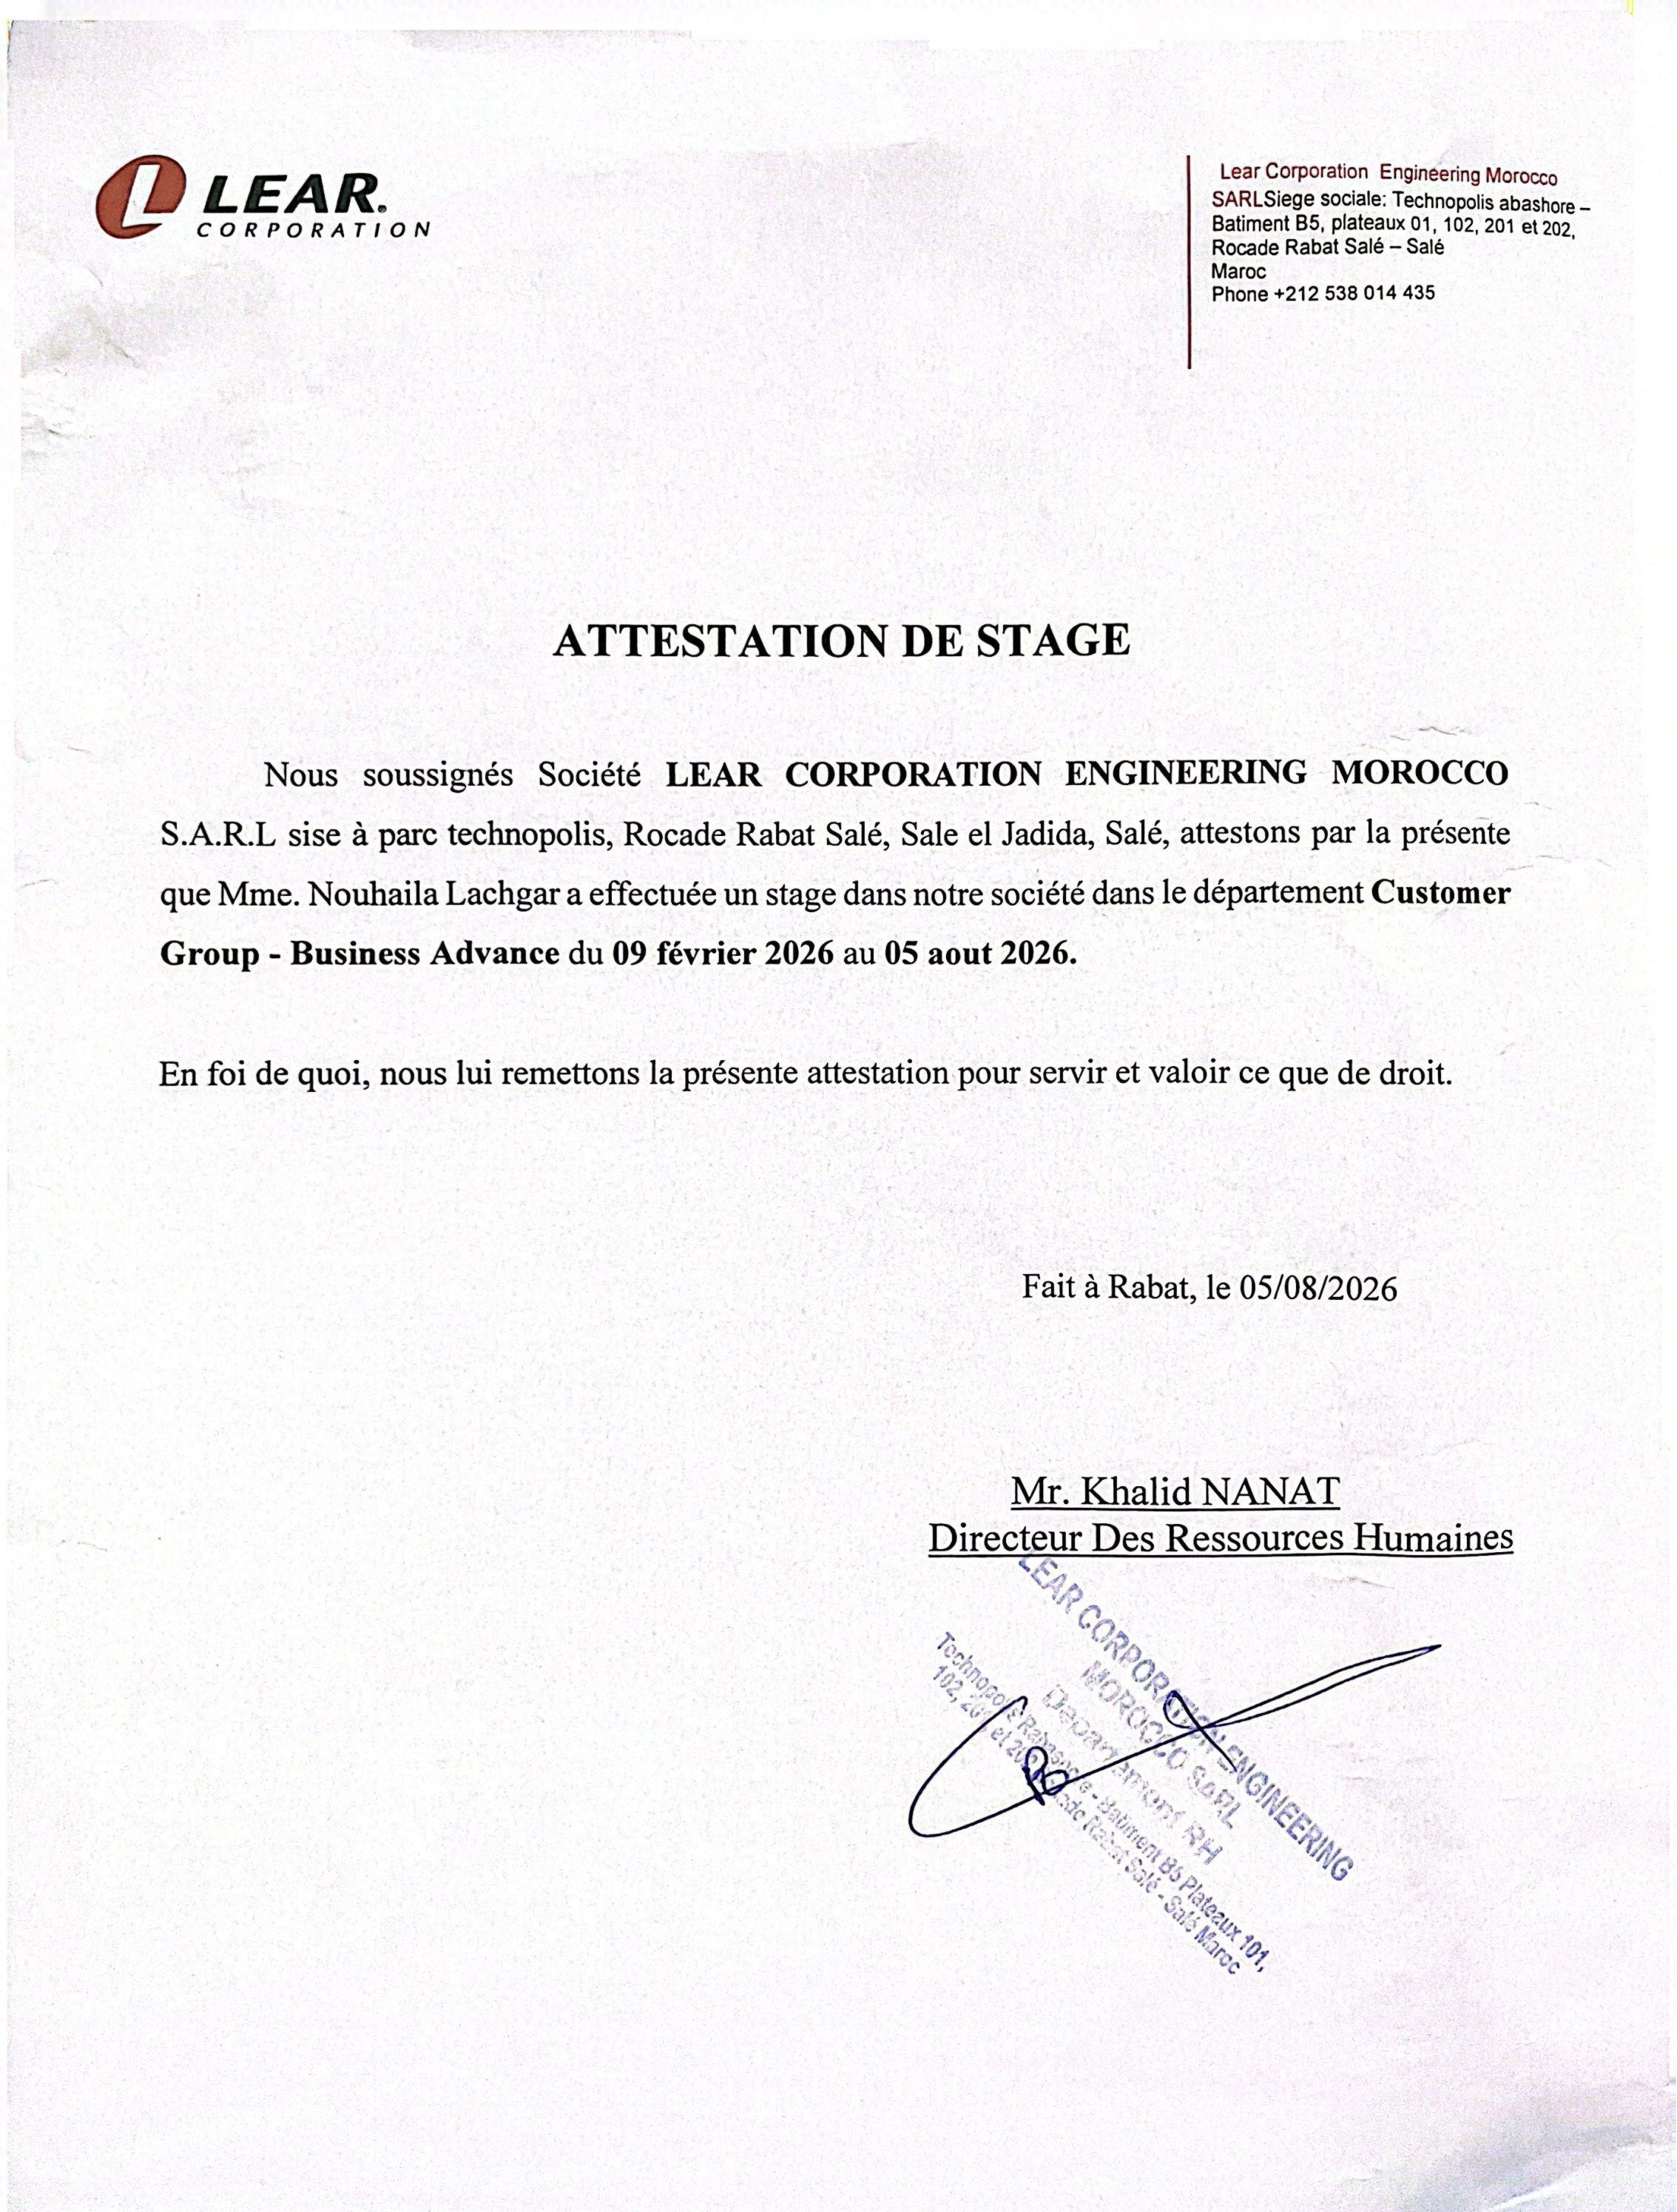
Implementing an automated ETL pipeline using SSIS then Building an Interactive dashboard ( Nouvelle Aveiro Maroc | September 2025)
I implemented an ETL pipeline through SSIS, automated it through SSMS by creating a scheduled job and created a Power BI dashboard with all the KPIs communicated during business requirements' gathering reunion
Used tools : SSIS, SSMS PowerBI
Soft Skills : Business Requirements Analysis
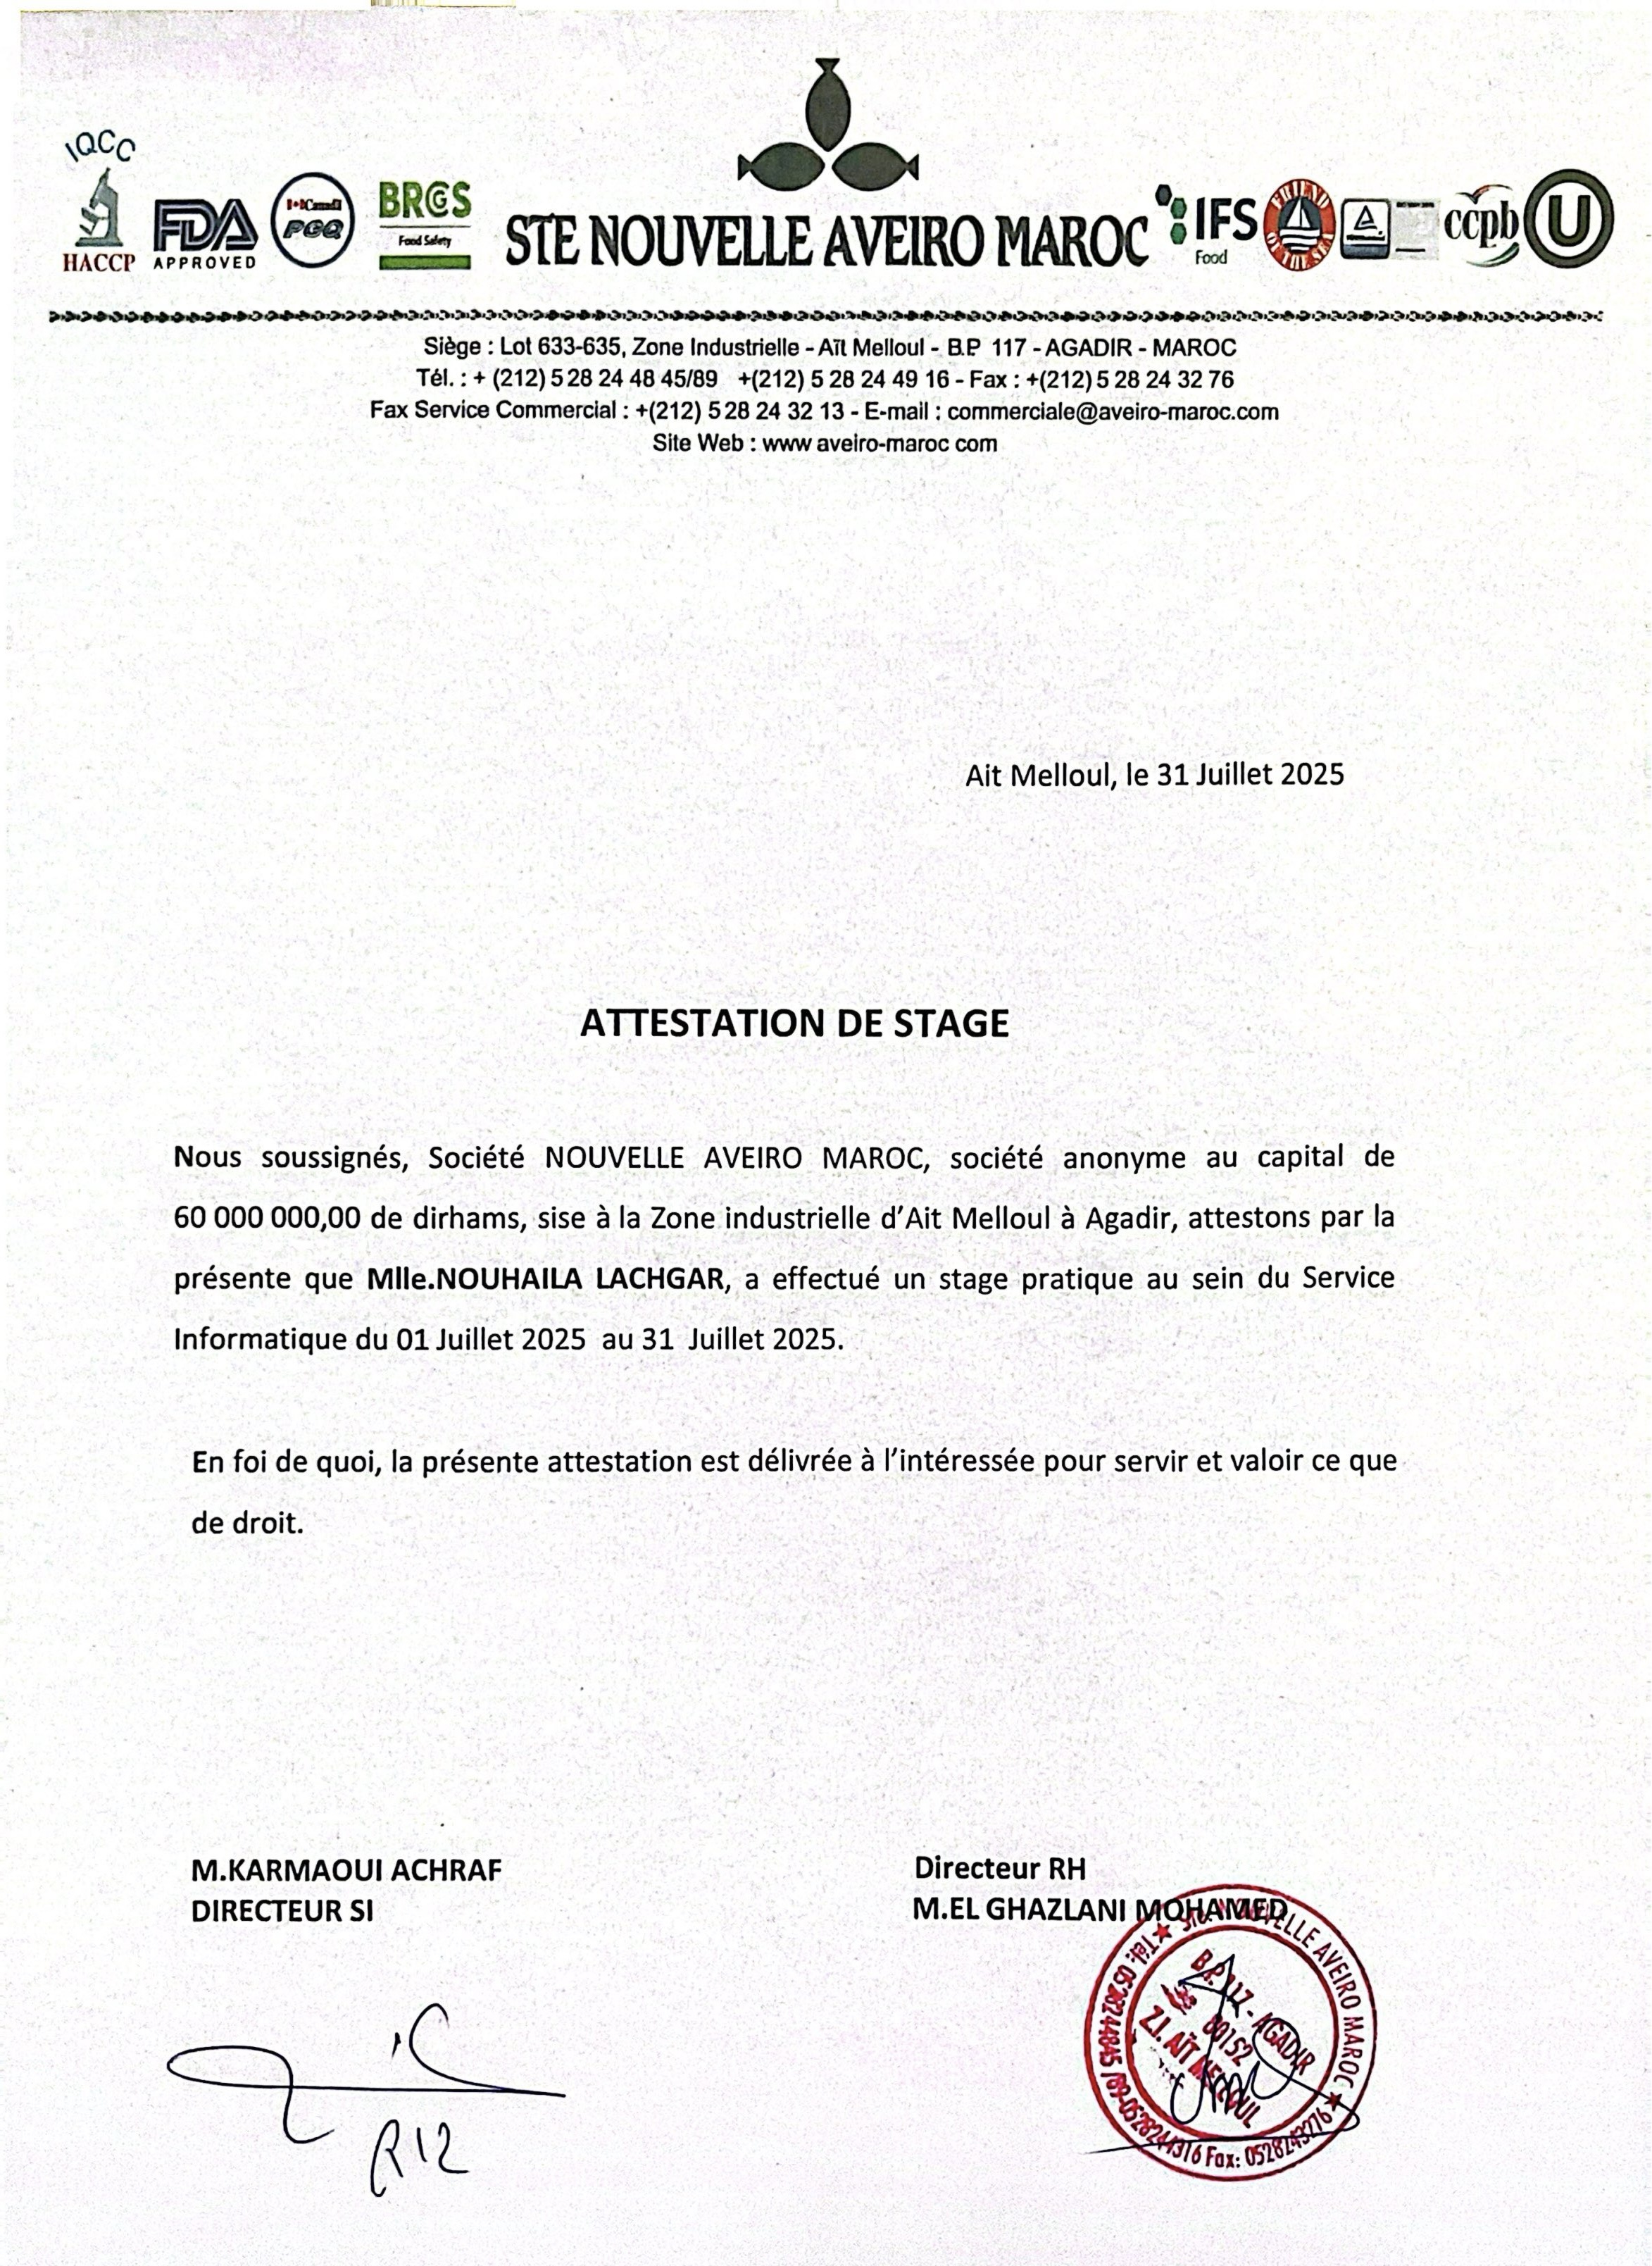
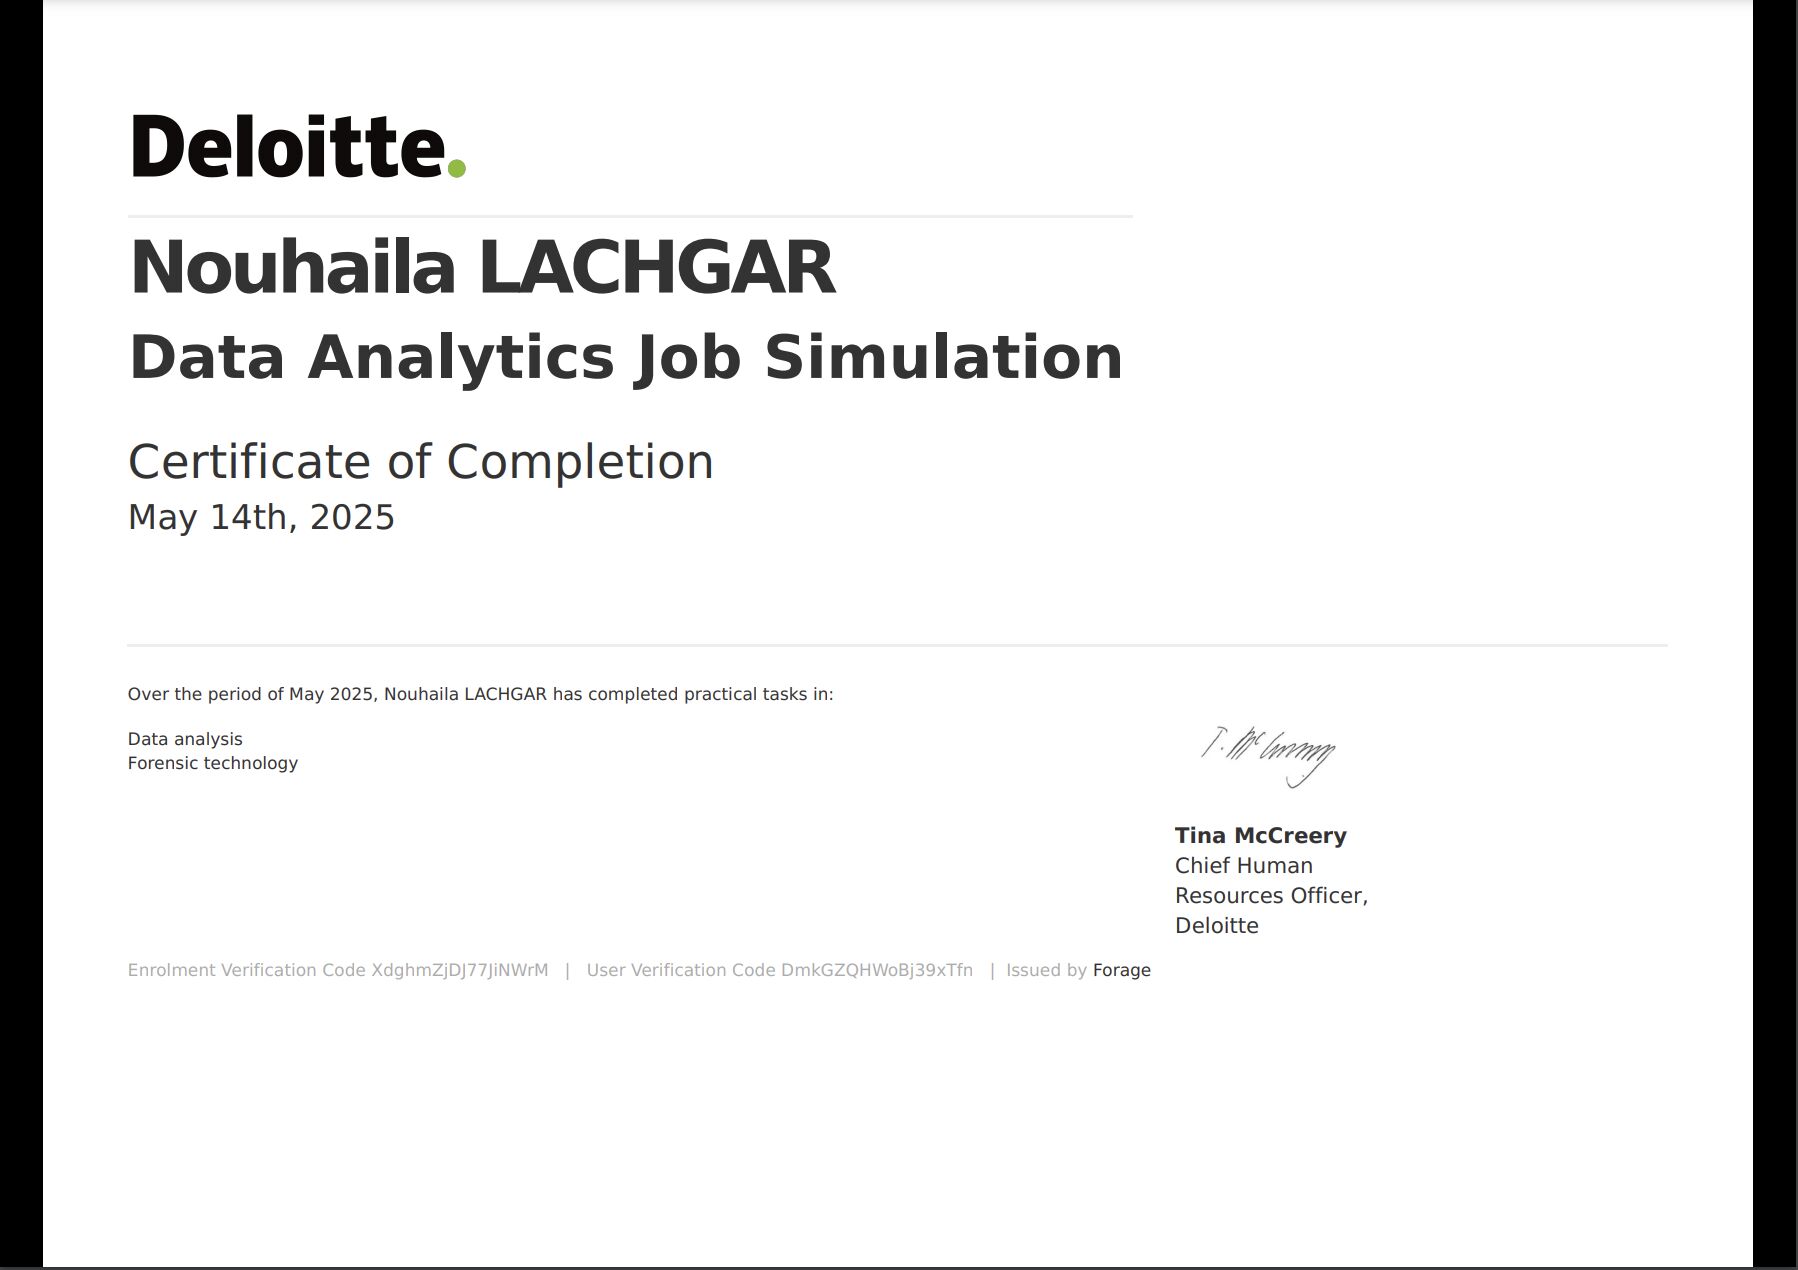
Deloitte Australia Data Analysis | Job simulation (Remote via Forage | May 2025)
I analysed data from a JSON file using PowerBI, learnt how to make visual filter using charts and how to make conditional columns based on another column’s values
Used tools : PowerBI
Soft Skills : Business Requirements Analysis
Tata Group Data Visualization using PowerBI | Job simulation(Remote via Forage | April 2025)
I Transformed data based on the business requirements, then I built a dashboard plus a storytelling via an explanatory video.
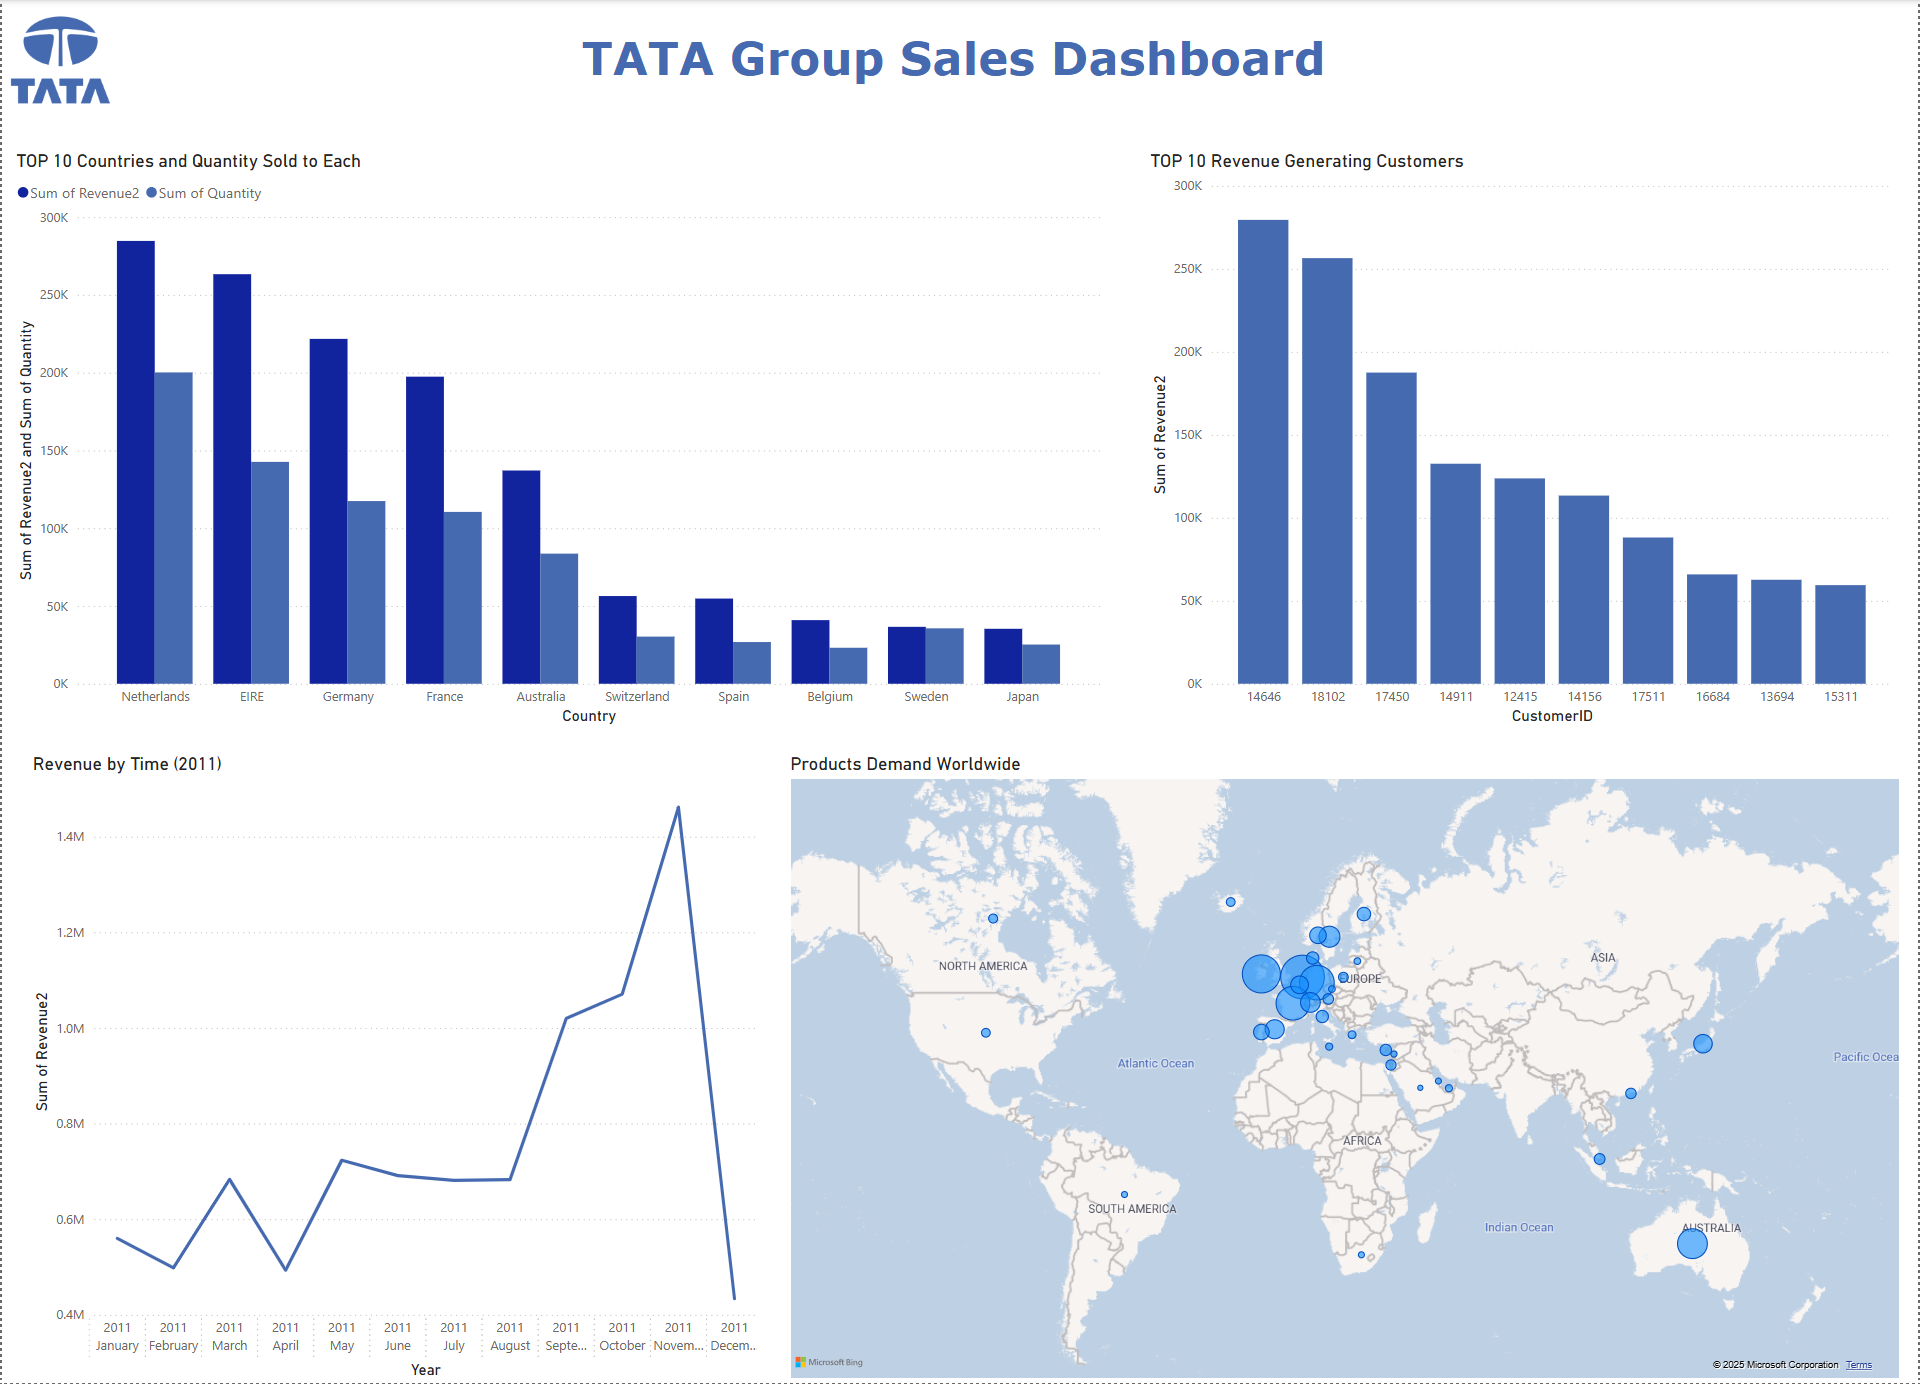
Used tools : PowerBI
Soft Skills : Business Requirements Analysis, Storytelling
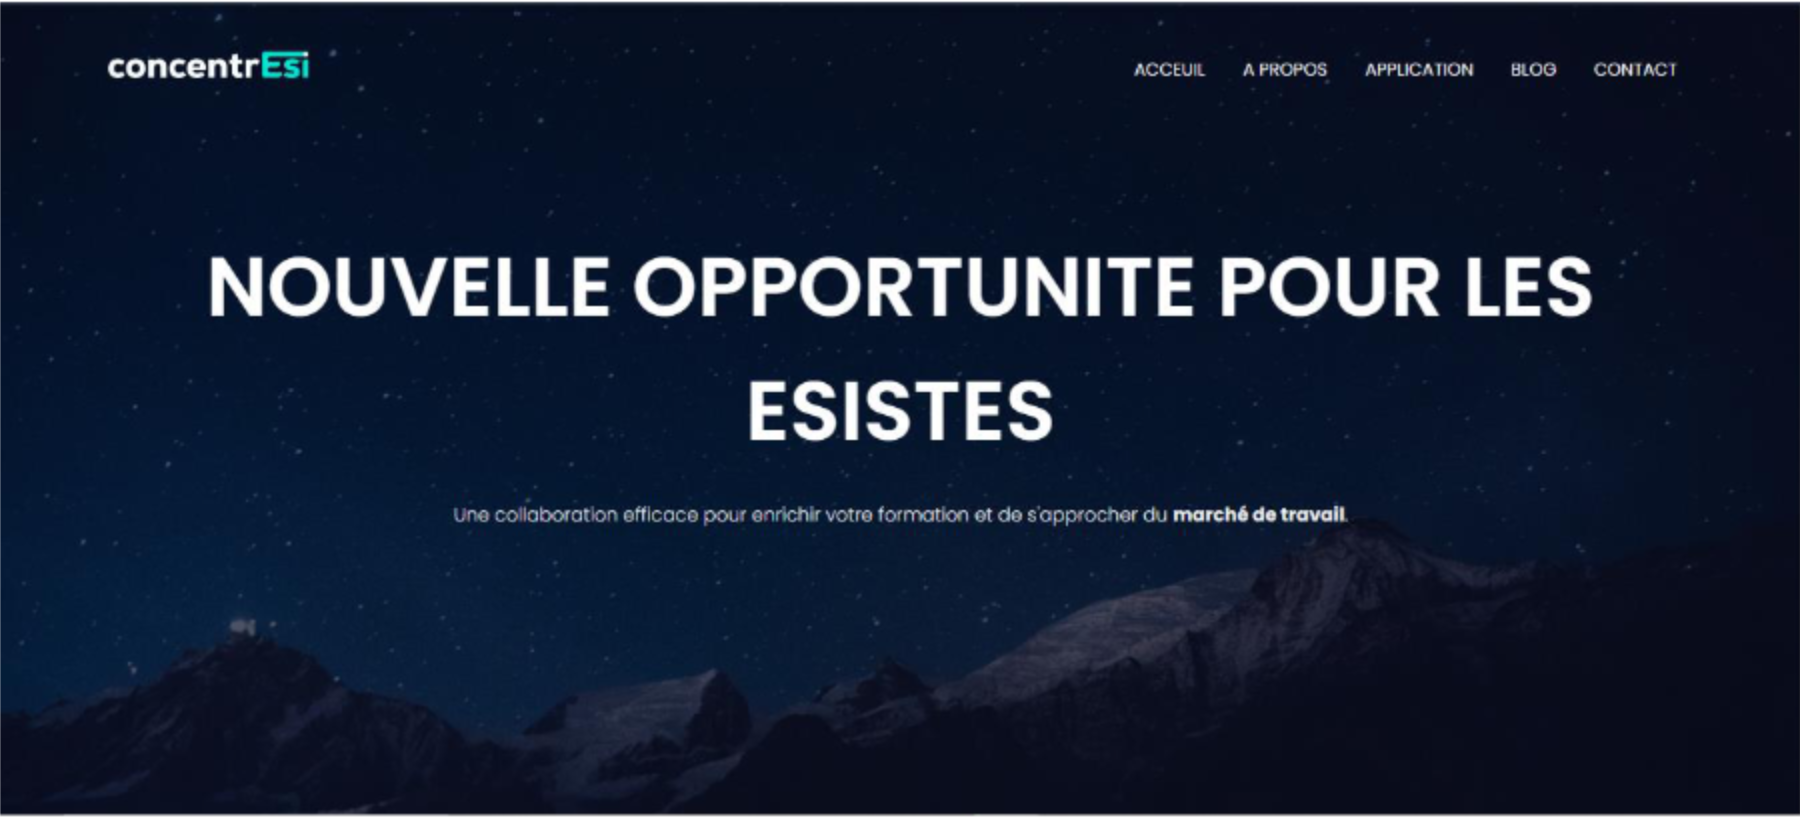
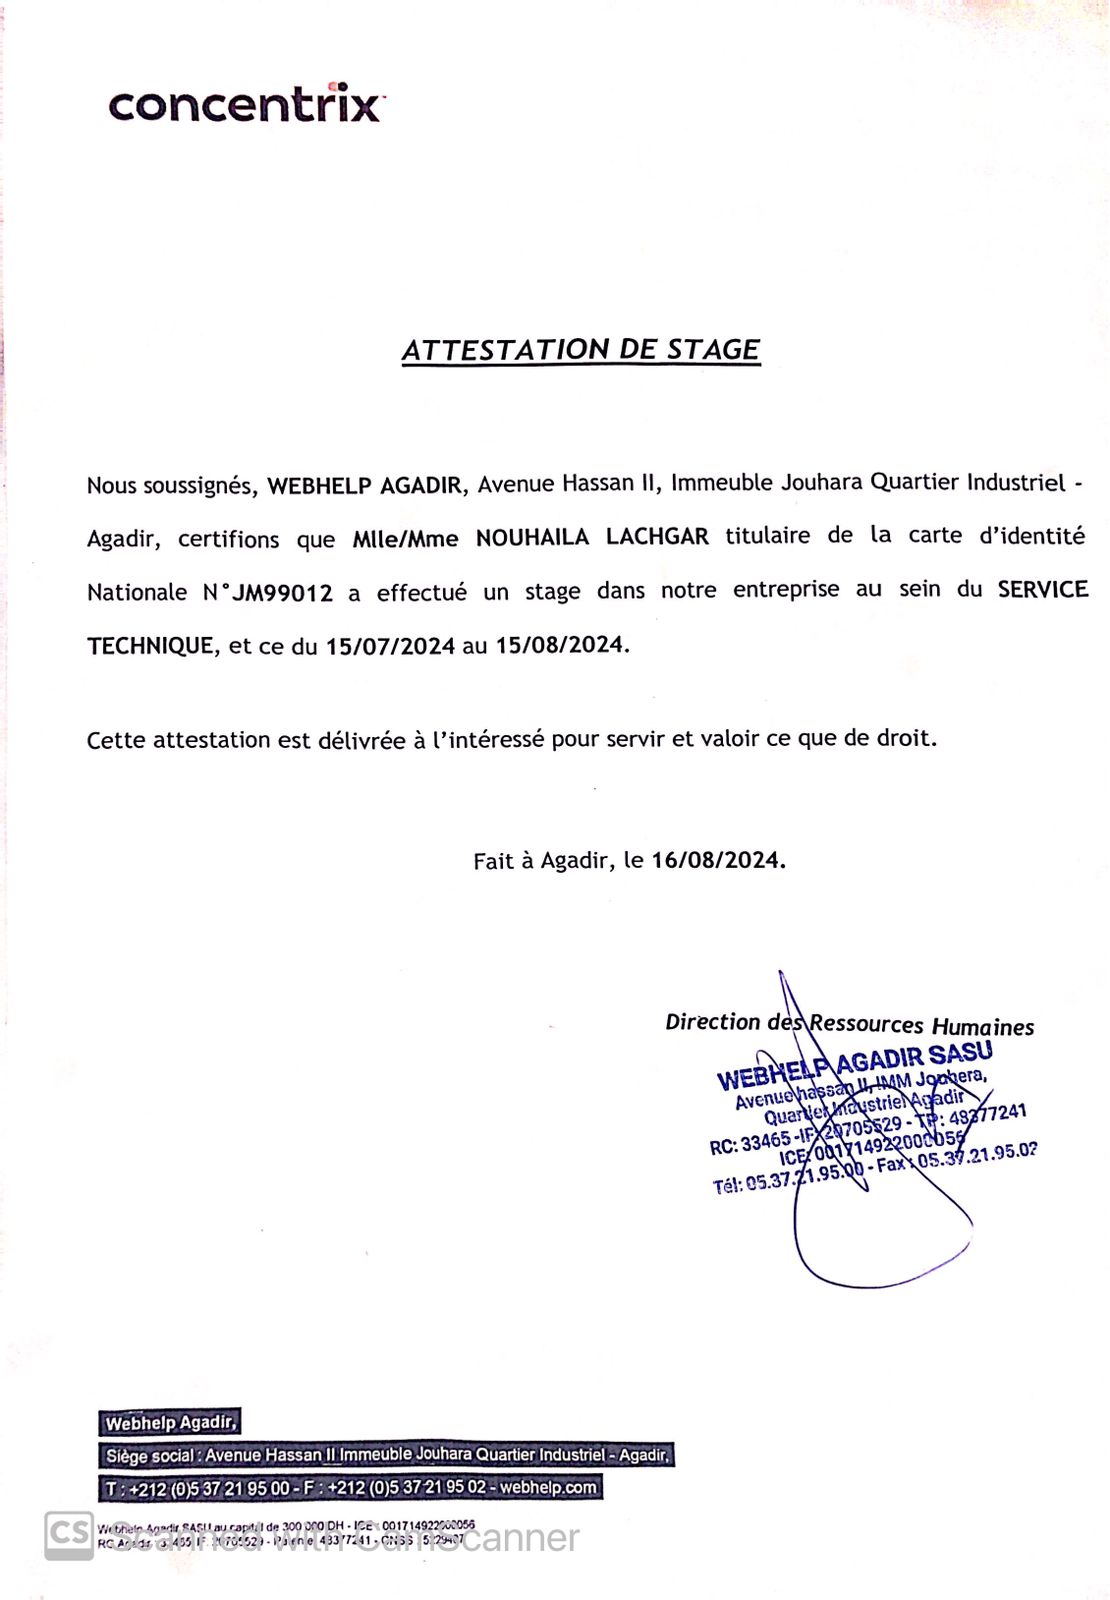
Concentesi WebApplication for Internship Application | Internship(Concentrix Agadir | July-August 2024)
I Developed a web application for scholar internship application called Concentresi between ESI students and Concentrix